The Prosperity Quintet in Belgium
2012
2010
Introduction:
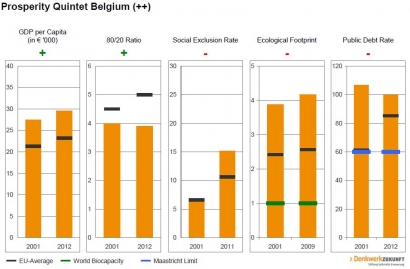
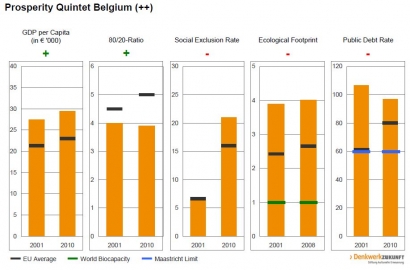
In the Prosperity Quintet charts for each of the EU member states (EU27), both the most recent year and the year 2001 (or the next available value) are given for each indicator.
With a few exceptions, such as GDP per capita for Luxembourg or the public debt rate for Greece, the indicators for each country use the same scale to enable better comparison.
GDP per capita is shown in thousands of euros, and social exclusion rates as a percentage of the total population. The 80/20 ratio reflects the relationship between the sum of the incomes of the top 20 percent relative to that of the lowest 20 percent. For all three indicators, countries that do better than the EU27 average are marked with a “+”, while those that fare worse receive a “-”.
The ecological footprint is shown in relation to global biocapacity, in each case per capita. Countries that do better than the EU27 average are marked with a “(-)”, while those that fare worse receive a “-”. Only countries with a value less than or equal to 1 are given a “+”. None of the countries fall into this category at present.
The public debt rate indicates gross public debt as a percentage of GDP. Countries with a value less than or equal to the Maastricht limit of 60 percent are marked with a “+”. Those with a value above the EU average have a “-”. Countries that lie between the Maastricht limit and the EU average receive a “(-)”.